


In the past three years there has been a rise in the use of continuation vehicles, in particular, single asset continuation funds (SACFs). This is now considered a fourth exit route, adding to the traditional exits of IPOs, strategic sales and sponsor-to-sponsor transactions.
While SACFs present an alternative exit for certain portfolio companies, not every asset is a suitable candidate for this type of transaction. In part 1 of this series, we explore the characteristics that make a portfolio company well-suited for a SACF and the drivers that have led to the growth of this type of transaction. In part 2, we will cover how to navigate the complexities of SACF transactions including preparing for the corporate process, managing conflicts of interests, and reducing the risk of litigation.
Defining single asset continuation funds: In a SACF, one of the assets in an existing fund is sold to a newly created single investment fund (and sometimes also the latest flagship fund) managed by the same sponsor. Investors in the existing fund are given the option to either cash out or continue to stay invested through the new vehicle alongside new secondaries investors, i.e., new limited partners (LPs) that only join the continuation fund. This contrasts with traditional exits where the asset would be sold to an external buyer.
SACFs are often used by managers that wish to extend their hold on high-performing portfolio companies beyond the typical private equity fund life cycle, offering additional time and capital to achieve growth objectives while simultaneously providing liquidity to investors. Given the single asset focus, SACFs are associated with higher-conviction assets than multi-asset continuation vehicles.
Characteristic of companies in SACFs
The characteristics that make a portfolio company suitable for a successful continuation fund in many ways overlap with those that make an asset attractive for a private equity buyout. However, there are characteristics that we see as differentiating the types of deals suitable for SACFs and these include industry, deal size/company maturity and financial stability including leverage.
Industry
The industry breakdown of SACF deals in 2024 shows that healthcare, technology and business services (closely followed by industrials) were the most popular industries. The breakdown shown in Figure 1 is broadly aligned to buyouts, but interestingly, a closer comparison of sector allocations between SACFs and buyouts showcases some divergence (see Figure 2).
Healthcare stands out with a +6% overrepresentation in SACFs, which may reflect its long development cycles and relatively non-cyclical nature, which in turn justifies why a SACF may be useful to unlock the longer-term value potential. Conversely, Consumer and Retail shows a -6% gap - it represents 17% of buyout deals over the period1 but only 11% of SACFs. The lower representation may be due to Consumer and Retail businesses having growth prospects that are more realisable in the short-term. Additionally, they may be seen to face greater challenges than other sectors making them less attractive for a single asset continuation fund.
Figure 1: Percentage of deals by SACF industry, 2024

Source: Lazard 2024 Secondary Market report.
Figure 2: Industry over/under representation in SACFs vs. buyouts deal count, 2024

Source: Macfarlanes analysis of Preqin Ltd data.
Secondaries investors often cite a preference for non-cyclical industries when investing in SACFs. As such, we expect to see fewer cyclical companies in SACFs when compared to buyouts as in buyouts market cyclicality can more effectively be used as a value creation lever by timing acquisitions and exits strategically over the life of the fund.
Deal size/company maturity
When considering size, we see that SACFs are much less present in the lower market when compared to buyout deals – only 6% of SACFs have deal sizes under $100m compared to 48% for direct buyouts. This result is aligned with the view that SACFs focus on more mature and higher-value assets. The larger size of these transactions can signal quality and lower risk for potential investors, which is particularly relevant given the concentrated nature of SACFs, but other factors also play into the preference for larger deals:
- Transaction costs: SACF transactions can involve significant costs, including valuation, legal, and secondaries advisory. Larger deal sizes make the transaction economically viable for both GPs and LPs.
- Secondaries investors’ due diligence costs/capacity: Investors may perceive a small single-asset deal as not being worth the due diligence cost and effort.
- Alignment: SACF investors look to establish how meaningful the SACF is for the GP. If the continuation vehicle represents a very small percentage of the GP’s AUM, or of its carry, then LPs can be concerned that the GP will not be as focused. From the GP perspective this is also true, a larger deal with more potential for fee generation is what makes the effort of a SACF worth it. Therefore, companies that are larger and often more mature contribute to alignment of interests.
Figure 3: Comparison of SACF vs. buyout deal size, 2018-2024

Source: Macfarlanes analysis of Preqin Ltd data.
As the SACF market evolves we expect to see an even greater prevalence of SACFs in the mid-market and the lower-mid market. GPs operating in these segments have seen this solution be tested by larger peers and are growing in confidence to utilise it themselves.
Volatility and leverage
The expectation is that an ideal SACF target will have more stable cashflows and lower volatility when compared to a direct buyout target. Buyout deals involve acquiring and transforming companies, which is associated with a higher risk-return profile. SACFs on the other hand focus on maximising the value of established, successful companies, which tends to be a comparatively more conservative approach. This aligns with the risk profile of secondaries investors who often seek better risk-adjusted returns by focusing on the “de-risked” stages of the investment cycle where there is greater visibility. The expectation is that SACFs should have lower standard deviations than buyouts while achieving somewhat similar average returns. Given the market is still nascent for SACFs and vehicles typically have four-year durations, it is too early to have conclusive data on standard deviations, however, the types of assets included in SACFs are frequently seen to align with this lower risk profile.
Figure 4: Loss ratio for buyouts vs. continuation funds, 2018-2023

Source: Morgan Stanley Private Capital Advisory, The Case for Continuation Funds: An Initial Performance Review, August 2024.
Direct buyouts often involve higher levels of initial leverage, as debt is commonly used to amplify returns by financing a large portion of the purchase price, often up to 60-70% per unit of equity investment2. For SACF targets, the leverage profile is often lower. This can be attributed to assets often being deleveraged while in the original fund and to SACF transactions often not using additional leverage – according to Evercore many single-asset deals maintain the same capital structure3.
Figure 5: Percentage of respondents using third-party leverage

Source: Evercore H1 2024 Secondary Market Review.
While SACFs may not significantly increase total leverage, debt facilities at the continuation vehicle level – such as subscription facilities or NAV financing – are often used. NAV financing represents real leverage, similar to the buyout model but at the fund level. However, even in these cases, leverage remains lower than in traditional buyout.
Moving away from stand-alone portfolio company characteristics, two other (more situation specific) factors also help identify a portfolio company as a good SACF candidate. These are strategic fit with the GP and management team alignment.
Strategic fit
In a blind pool buyout fund, there is a higher initial level of risk regarding the strategic fit of the GP and the portfolio companies. LPs must trust that GPs will select companies aligned to their expertise, as per the fund’s stated strategy. SACFs on the other hand continue an existing relationship between a GP and a portfolio company, which in most cases has already been proven to be successful. This can be seen to reduce the blind-pool risk on strategic fit, however, when a “crown jewel” asset has experienced significant growth in the original fund, the next growth phase may require a significantly different skillset. For example, if the company needs to expand into new markets where the GP lacks presence or expertise, this could create misalignment. As such, an asset suitable for a SACF is one where the growth trajectory is aligned with the GP's skillset.
While in a buyout fund context, GPs can bring in advisors or even co-investors with specialised knowledge to help drive growth, this is less common in continuation vehicles. Strategic co-investors are typically introduced alongside buyout funds on a zero-fee/joint venture basis, which is likely to face more scrutiny in a SACF than in a buyout fund. This is due to the heightened visibility in SACFs and the fact that the GP is incentivised to demonstrate that it is well-placed to drive continued growth. Acknowledging the need for a partner could undermine this argument. This reinforces the conclusion that, regardless of prior strategic fit, an ideal SACF target is one with a growth trajectory that remains aligned with the GP's skillset.
Management team alignment
Like any buyout fund investment, SACF transactions require alignment between the fund and the target company's management team. An ideal SACF target therefore being one where the management team is committed to staying on and executing the next phase of growth. If this alignment is lacking, it could jeopardise the success of the continuation vehicle. As such, the existence of scope for continued alignment with a management team also marks out portfolio companies as suitable for a SACF.
SACFs growth drivers
In the last five years GP-led secondaries have grown significantly as a percentage of the secondaries market. Today secondaries are broadly split 50/50 between GP and LP-leds.
SACFs have been a key driver of this growth, accounting for 53% of all GP-led transactions in 2024, a sharp rise from less than 10% in 20184. The expansion of the GP-led secondaries market and SACFs has been fuelled by several factors, including challenging exit conditions, LPs' increased need for liquidity due to slower distributions and greater acceptance among LPs.
Figure 6: Secondaries transaction volume

Source: Evercore H1 2024 secondary market survey.
Unfavourable exit conditions
SACFs have gained traction in a higher interest rate environment, where traditional exit routes, such as IPOs, have become less favourable due to higher financing costs, compressed valuations and reduced risk appetite in public markets. The global PE exit value fell to a five-year low in 20245.
In this context, SACFs have emerged as an increasingly popular exit alternative, providing liquidity solutions where conventional exits remain challenging. While interest rates are expected to come down and exit options are expected to improve, SACFs have now become a tool within private markets that is unlikely to go away even in more favourable exit conditions.
Figure 7: US IPO activity overlaid with federal interest rates, 2018–2026 (rates as at 1 January)

Note: *According to Stock Analysis there have been 70 IPOs on the US stock market as of 27 March 2025. This is 84.21% more than the same time in 2024, which had 38 IPOs by this date ; Interest rate forecast for 2026 is based on the median of policymaker projections.6
Source: Stock Analysis, Federal Reserve, Reuters.
Longer holding periods and LP liquidity needs
GPs are holding assets longer which in turn is impacting LPs’ liquidity. In 2023, the average holding period for buyouts among U.S. and Canadian private equity funds reached 7.1 years, the longest in two decades7. This has had a negative impact on net distributions, i.e. distribution minus capital calls. 2022 and 2023 saw the lowest net distributions in buyouts since 20086. Although, net distributions for the H1 2024 showed some recovery, when looking at a distributions as a percentage of buyout AUM, the picture is more negative. According to Bain 2024 distributions fell to their lowest value in over a decade – 11% of net asset value9.
Figure 8: Annual net distributions across for buyout

Source: Preqin Ltd.
LPs have reacted to the lack of distributions by increasing their presence in secondary markets. In 2024, investors sold a record $162bn worth of private equity stakes on secondary markets, a 45% increase from the previous year10.
Increased LP acceptance
Initially, continuation vehicles faced some scepticism mainly due to the potential for conflict of interest. Over time, increased transparency and alignment tools improved acceptance by both existing and new LPs.
Some LPs are revising their internal approval protocols to be able to roll over when offered to participate in continuation fund opportunities – often the timelines of approval processes are a key barrier e.g. if board approval is required. According to an LP survey by PEI11, 14% of LPs surveyed have made amendments within their organisations to accommodate their ability to back GP-led continuation funds. Others are participating in the market through funds dedicated to GP-led secondaries.
This acceptance may in part be a consequence of reports of positive performance. According to Morgan Stanley, continuation funds have outperformed buyout funds showing a higher multiple of invested capital (MOIC).
Figure 9: Multiple of invested capital (MOIC) – continuation funds vs. buyouts, vintage years 2018-2023
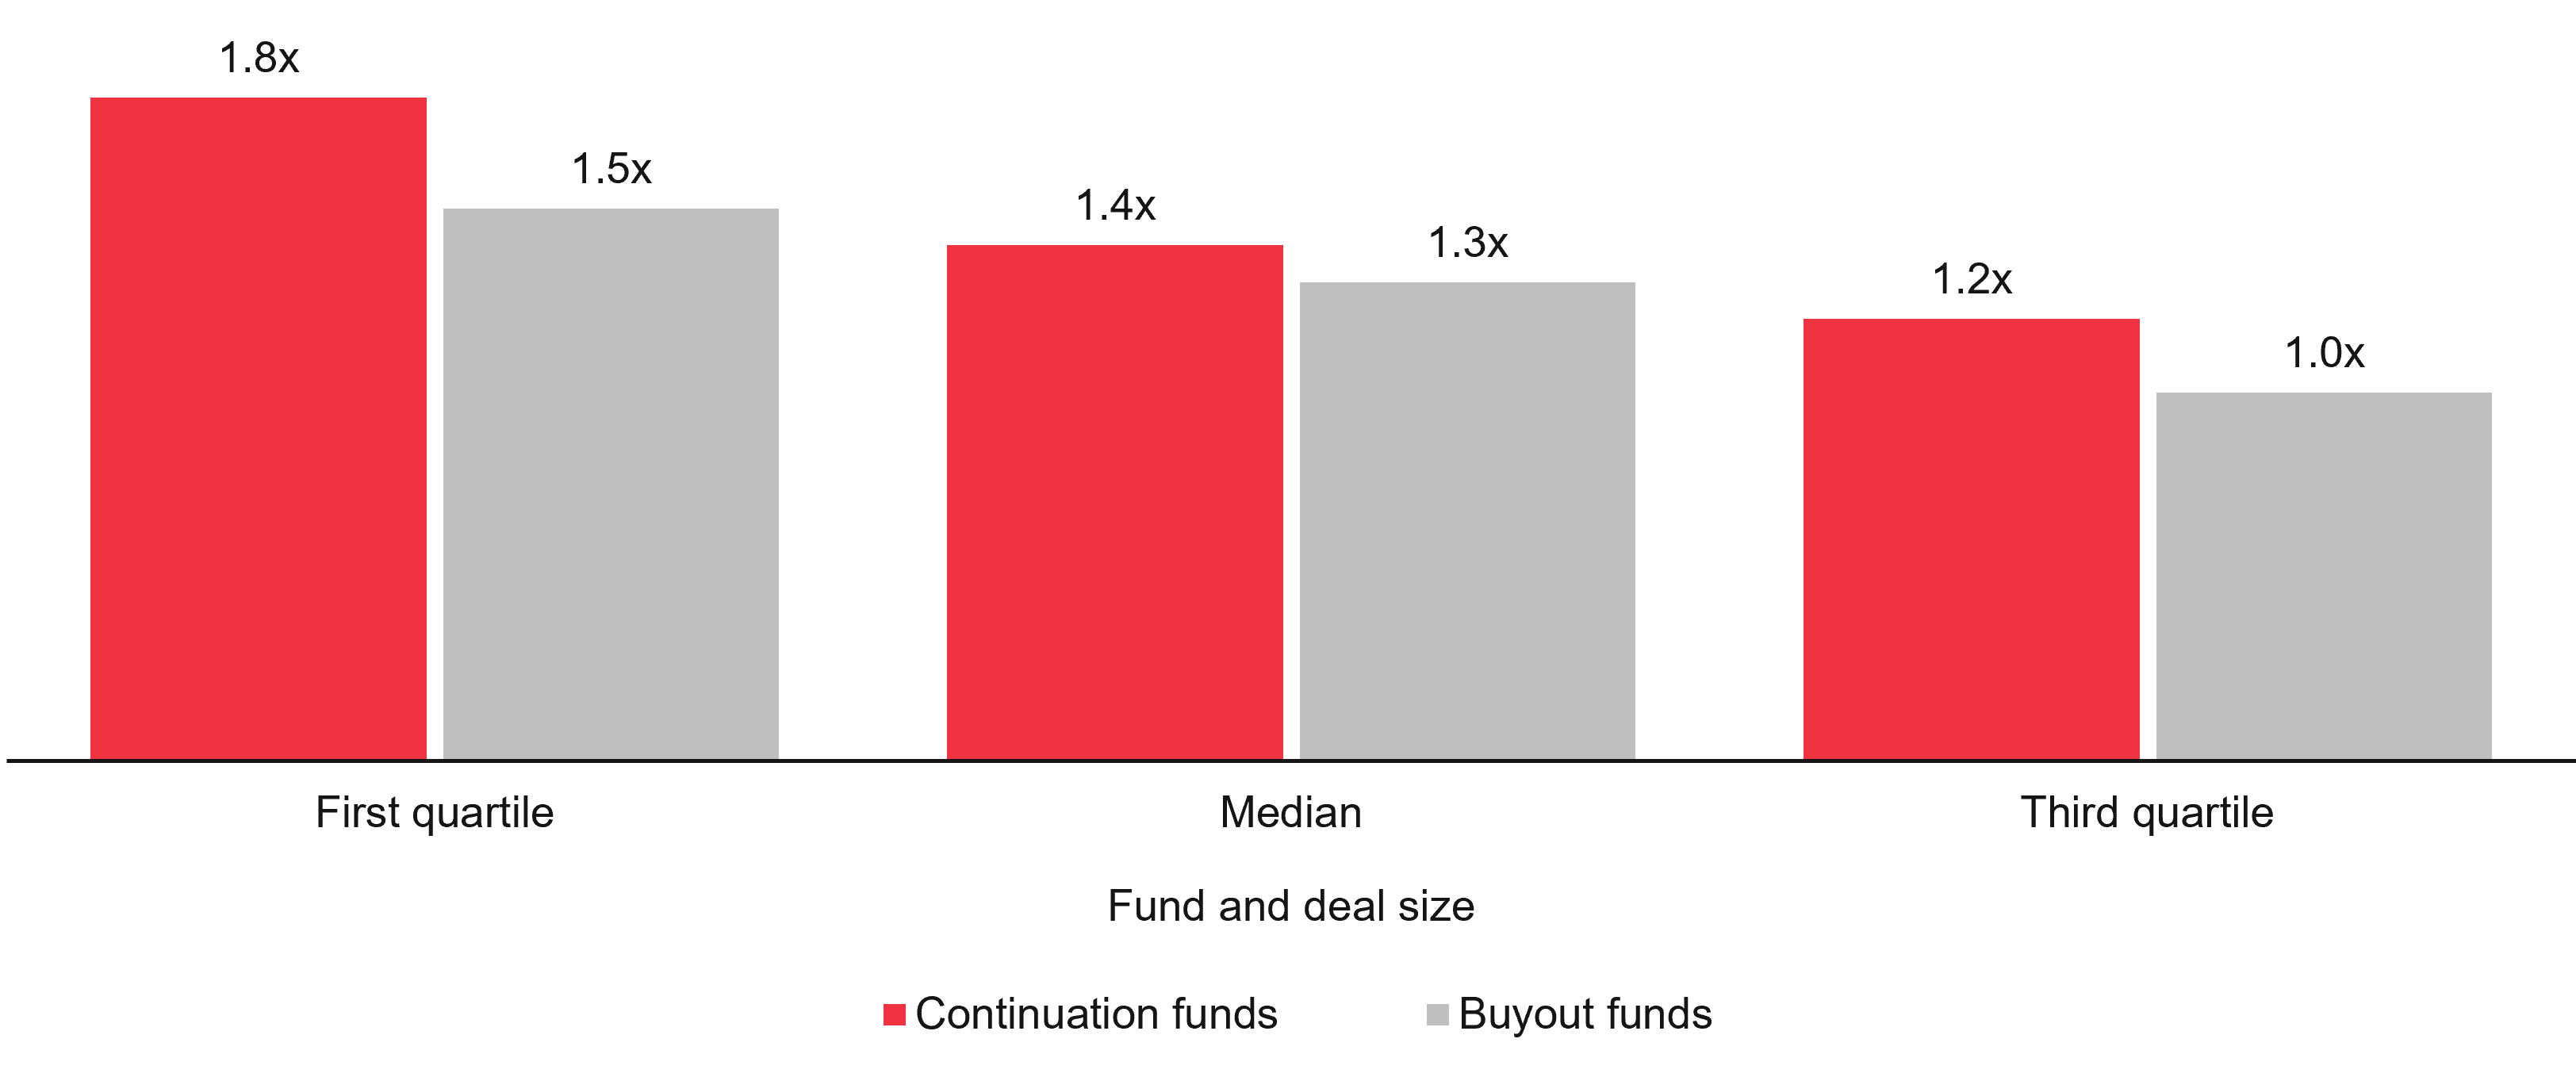
Source: Morgan Stanley Private Capital Advisory, the case for continuation funds, August 2024.
Key takeaways
- Industries favoured by SACFs are broadly the same as those seen in buyouts. Divergences in healthcare (more popular in SACFs) and Consumer and Retail (less popular in SACFs) align with the view that a good SACF target is a strong performer where additional time and capital are required to maximise value.
- Compared to buyouts, SACF targets tend to exhibit lower volatility and be less levered. Targets have historically been larger, but there is increasing activity in the mid-market.
- SACFs reduce blind-pool risk by continuing an existing GP-portfolio company relationship, but strategic fit and continued alignment with the portfolios company’s management team should not be taken for granted. Both are essential to execute on the growth potential of the target company.
- SACFs are expected to remain a key feature of private equity, even as exit conditions improve. With increasing capital supply from secondaries investors and growing acceptance from LPs, SACFs are evolving from a liquidity-driven tool into a mainstream exit strategy.
In part 2 of our series on single-asset continuation funds, we focus on some of the technical and commercial developments in this space, as the SACF becomes a fourth exit for private capital managers of all shapes and sizes.
- According to Preqin Ltd buyout deals categorised as “consumer discretionary”.
- According to MSCI, in the ten years through 2023 the average for global buyout companies was 74 cents of borrowing for every dollar of equity investment.
- According to Business Insider - Evercore: Are single-asset secondaries a new normal in the GP-led space?
- According to Harbourvest - Research Validates Growing Adoption of Continuation Transactions.
- According to S&P Global - Private equity exit value falls to 5-year low.
- According to Reuters - Fed policymakers project two rate cuts this year, some see fewer.
- Private equity buyout funds show longest holding periods in two decades.
- According to Preqin Ltd data.
- According to the FT - Private equity industry shrinks for the first time in decades.
- According to the FT - Investors offloaded record volume of private equity stakes in 2024.
- According to Private Equity International - Continuation funds: Should LPs commit or roll?


